Accuracy, precision and significant figures notes & mcqs with answers & explanations | pharmaceutical chemistry – hprca pharmacy exam
PHARMACEUTICAL CHEMISTRY
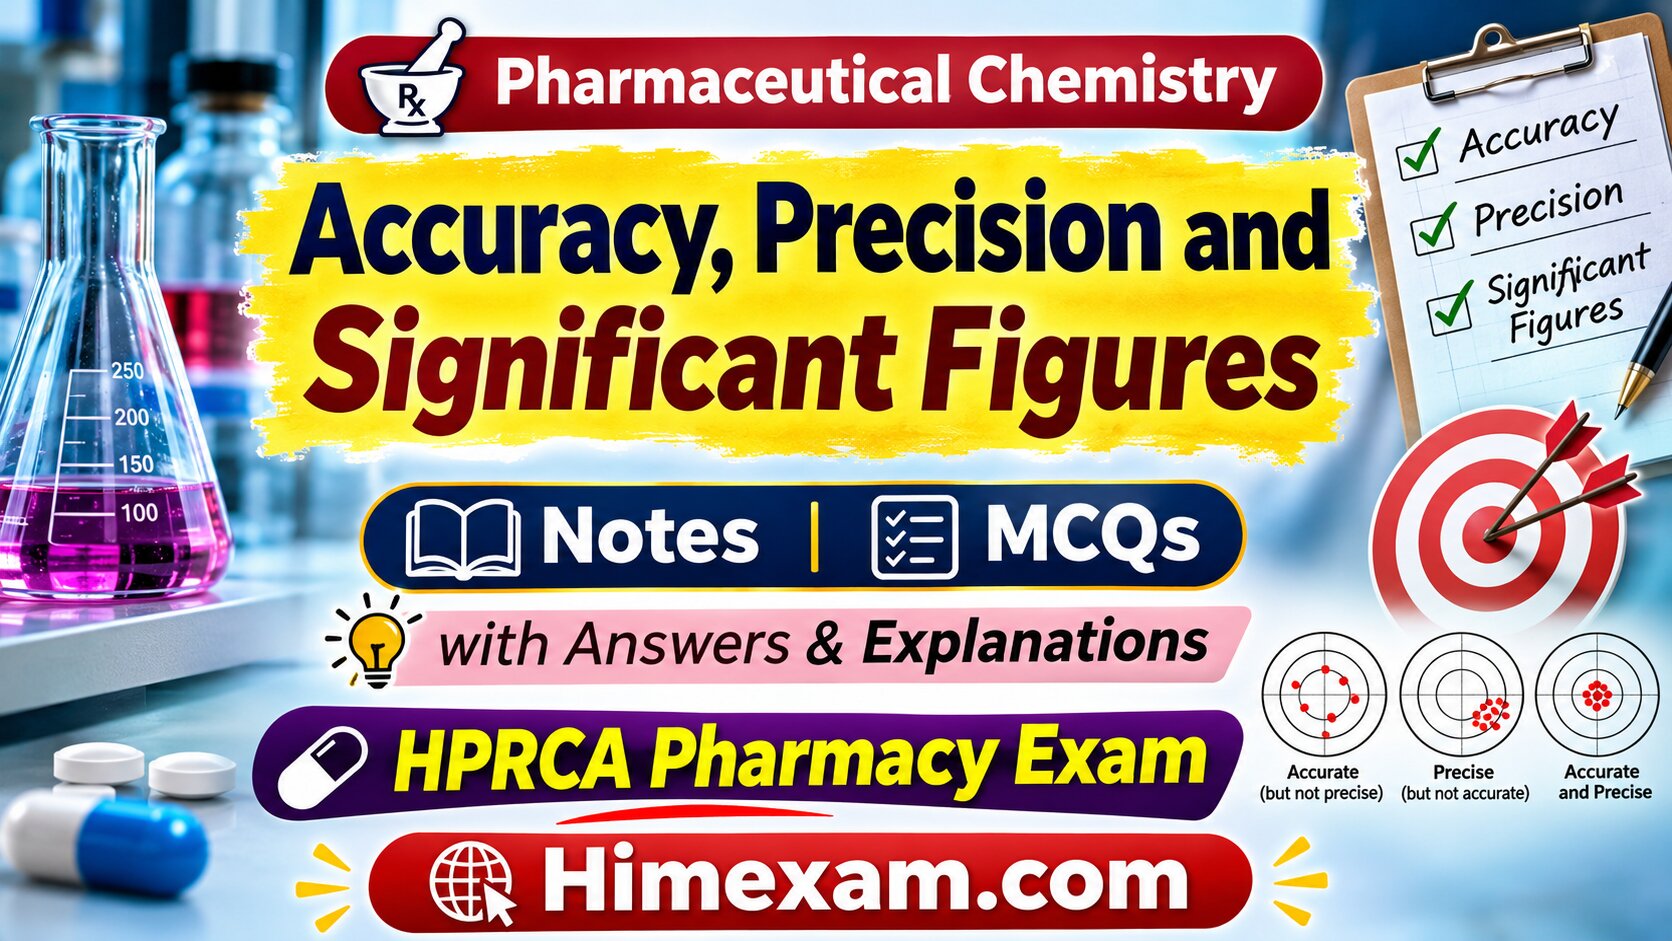
Accuracy, Precision and Significant Figures
1. Introduction
In pharmaceutical chemistry, accurate measurement is essential at every stage of drug analysis, formulation and quality control. A small error in weighing an active pharmaceutical ingredient (API), preparing a standard solution or measuring the concentration of a drug can affect the final analytical result.
Advertisement
Download Himexam.com Android App
For example, suppose the actual concentration of a standard solution is 10.00 mg/mL. If an analyst repeatedly obtains values close to 10.00 mg/mL, the measurements show good agreement with the reference value. However, if the results are widely scattered, the method has poor precision.
Three important concepts help us understand the quality of numerical measurements:
Accuracy: How close a measured result is to the accepted reference value.
Precision: How close repeated measurements are to one another.
Significant figures: The digits that communicate the precision of a measured or calculated value.
Examination point: Accuracy and precision are not the same. A result can be precise but inaccurate, accurate on average but imprecise, or both accurate and precise.
Accuracy is the closeness of agreement between the result of a measurement and the true or accepted reference value of the quantity being measured.
In simple language, accuracy tells us how close our experimental result is to the correct or accepted value.
Example: Accuracy in drug analysis
Accepted concentration of a drug solution = 100 mg/L.
Measured concentration = 99.8 mg/L.
The measured value is close to the accepted value, indicating good accuracy, subject to the applicable acceptance criteria and measurement uncertainty.
2.1 Methods of expressing accuracy
In analytical chemistry, accuracy is commonly evaluated by comparing measured results with known or accepted reference values. Recovery and percentage relative error are useful numerical measures for this purpose.
A. Percentage Recovery
% Recovery = (Amount recovered / Amount added) × 100
Used particularly in recovery or spiking studies.
Example: A sample is spiked with 50 mg of a drug substance. The analytical procedure measures 49 mg of the added drug.
% Recovery = (49 / 50) × 100 = 98%
This indicates that 98% of the added analyte was recovered under the test conditions.
The negative sign indicates that the measured result is below the reference value.
C. Absolute Error
Absolute Error = Measured Value − Reference Value
Using the above example:
Absolute error = 98 − 100 = −2 mg.
Important distinction: Accuracy is a qualitative metrological concept. Percentage recovery and relative error are numerical ways of evaluating or describing aspects of analytical performance; they are not themselves the definition of accuracy.
2.2 Evaluation of accuracy in pharmaceutical analysis
According to ICH Q2(R2), accuracy should be demonstrated across the reportable range of an analytical procedure and under the regular test conditions, including relevant sample preparation and matrix effects.
Common approaches include:
Reference material comparison: Results are compared with a suitable certified or otherwise well-characterised reference material.
Recovery or spiking study: A known amount of analyte is added to the sample matrix and the recovered amount is determined.
Orthogonal procedure comparison: Results are compared with those obtained using a suitable independent analytical procedure.
2.3 Factors affecting accuracy
Incorrect calibration of instruments.
Impure reference standards.
Incorrect weighing of pharmaceutical substances.
Incomplete extraction of the drug from the sample.
Interference from excipients or other sample components.
Incorrect preparation of standard solutions.
Temperature and environmental variations.
Systematic errors in analytical procedures.
3. Precision
Definition
Precision is the closeness of agreement, or degree of scatter, among a series of measurements obtained from multiple samplings of the same homogeneous sample under specified conditions.
In simple words, precision tells us how consistently an analyst obtains similar results when an experiment is repeated.
Example: Precision in pharmaceutical analysis
An analyst determines the concentration of the same homogeneous drug sample five times.
Results: 99.8, 99.9, 100.0, 100.1 and 99.9 mg/L.
These results are close to each other, showing good precision.
3.1 Types of precision
ICH Q2(R2) describes three levels of precision in analytical procedures.
A. Repeatability (Intra-assay precision)
Repeatability is the precision under the same operating conditions over a short interval of time.
It is also commonly called within-run precision or intra-assay precision in appropriate contexts.
Conditions generally kept the same include:
Same analytical method.
Same laboratory.
Same analyst.
Same equipment.
Same operating conditions.
Short time interval.
Example: The same analyst performs six replicate determinations of a pharmaceutical sample using the same instrument during the same analytical run.
ICH Q2(R2) important fact: Repeatability may be assessed using either:
At least 9 determinations covering the reportable range, for example 3 concentrations with 3 replicates each; OR
At least 6 determinations at 100% of the test concentration.
B. Intermediate Precision
Intermediate precision measures variations within the same laboratory when relevant experimental conditions are changed.
It is also known as within-laboratory precision.
Factors that may be varied include:
Different days.
Different analysts.
Different instruments or equipment.
Different environmental conditions.
Example: Two analysts perform the same drug assay on different days in the same laboratory using the analytical procedure under evaluation.
C. Reproducibility
Reproducibility refers to precision between different laboratories.
It is generally evaluated through inter-laboratory studies or collaborative trials.
Example: Three different pharmaceutical quality-control laboratories analyse the same homogeneous drug sample using the same analytical procedure and compare their results.
Type
Conditions
Example
Repeatability
Same laboratory, same analyst, same equipment and short time interval.
Repeated measurements in one analytical run.
Intermediate precision
Same laboratory, but relevant variations such as analyst, day or instrument.
Testing on different days by different analysts.
Reproducibility
Different laboratories.
Inter-laboratory collaborative testing.
3.2 Statistical methods used to express precision
Precision is generally expressed using standard deviation, variance or relative standard deviation (RSD), also called the coefficient of variation (CV).
A. Mean (Arithmetic Average)
Mean (x̄) = Σx / n
Σx = Sum of all observations; n = Number of observations.
Example: Five results are 10, 11, 12, 13 and 14.
Mean = (10 + 11 + 12 + 13 + 14) / 5 = 12.
B. Range
Range = Highest Value − Lowest Value
For the above results:
Range = 14 − 10 = 4.
C. Variance
Sample Variance (s²) = Σ(xᵢ − x̄)² / (n − 1)
Variance measures the average squared deviation from the sample mean, using n − 1 in the denominator for the usual unbiased sample variance estimate.
D. Standard Deviation (SD)
Sample SD (s) = √[Σ(xᵢ − x̄)² / (n − 1)]
Standard deviation indicates how widely the individual measurements are scattered around the mean.
A smaller SD generally indicates better precision when measurements are made on the same scale and under comparable conditions.
E. Relative Standard Deviation (RSD)
RSD (%) = (Standard Deviation / Mean) × 100
RSD expresses the standard deviation relative to the mean and is useful for comparing variability between datasets having different magnitudes or units.
F. Coefficient of Variation (CV)
For the usual analytical application, coefficient of variation is numerically the same as RSD when expressed as a percentage.
CV (%) = (SD / Mean) × 100
3.3 Numerical example: Calculation of SD and RSD
Solved example
Five analytical measurements are recorded:
10, 11, 12, 13, 14
Step 1: Calculate the mean.
Mean = 60 / 5 = 12
Step 2: Calculate deviations from the mean.
−2, −1, 0, +1, +2
Step 3: Square the deviations.
4, 1, 0, 1, 4
Step 4: Add the squared deviations.
Σ(xᵢ − x̄)² = 10
Step 5: Calculate sample variance.
s² = 10 / (5 − 1) = 2.5
Step 6: Calculate sample SD.
s = √2.5 = 1.5811
Step 7: Calculate RSD.
RSD = (1.5811 / 12) × 100
RSD = 13.18% (approximately).
Remember: Use n − 1 for the sample standard deviation. When the complete population is being described, population variance and SD use N in the denominator.
4. Difference Between Accuracy and Precision
Accuracy vs Precision – Visual Explanation
The central point represents the accepted reference value. The surrounding marks represent repeated measurements.
Accuracy
Precision
Closeness to an accepted reference value.
Closeness among repeated measurements.
Related to measurement bias and agreement with the reference value.
Related to the degree of scatter.
Evaluated using suitable reference materials, recovery studies or comparison procedures.
Evaluated using SD, variance and RSD.
Good accuracy means results agree with the reference value.
Good precision means repeated results show little scatter.
Not expressed as SD or RSD.
Commonly expressed as SD, variance or RSD.
Most important concept: A method may give very consistent results but still produce results that are consistently different from the accepted value. This is high precision with poor accuracy.
5. Errors in Analytical Measurements
An error is the difference between a measured value and a reference value. Errors can affect the accuracy and precision of pharmaceutical analytical results.
5.1 Types of errors
A. Systematic Error (Determinate Error)
A systematic error is a consistent or predictable effect that causes measurements to deviate in a particular direction or according to a systematic pattern.
It may cause a positive or negative bias.
Examples:
An analytical balance that consistently reads 0.02 g higher than the reference value.
Incorrect calibration of a pH meter.
A burette with an incorrect calibration.
Use of an impure standard substance.
Incomplete extraction that consistently underestimates drug content.
Sources of systematic errors:
Instrumental errors: Faulty or incorrectly calibrated instruments.
Method errors: Limitations or consistent bias associated with the analytical procedure.
Personal errors: Consistent observer-related mistakes, such as reading a meniscus incorrectly.
Reagent errors: Impure reagents or incorrect reagent concentration.
B. Random Error (Indeterminate Error)
Random errors arise from unpredictable variations in experimental conditions. They cause results to scatter around an average value.
Examples:
Small fluctuations in temperature.
Minor variations in instrument response.
Unavoidable reading variations.
Small unpredictable changes in environmental conditions.
Random errors primarily affect precision.
C. Gross Errors (Blunders)
Gross errors are major mistakes caused by carelessness or incorrect experimental operations.
Examples:
Using the wrong chemical reagent.
Recording 0.25 g instead of 0.52 g.
Using the wrong dilution factor.
Spilling part of the sample during analysis.
Incorrectly transferring experimental readings.
Gross errors should be investigated and corrected. Results should not be discarded without a scientifically justified reason.
Error type
Main characteristic
Typical effect
Systematic
Consistent bias or pattern
Accuracy
Random
Unpredictable scatter
Precision
Gross
Major operational or recording mistake
Can affect both
5.2 Methods of reducing analytical errors
Regular calibration of analytical instruments.
Use of certified reference materials wherever appropriate.
Proper training of laboratory personnel.
Use of suitable and validated analytical procedures.
Proper cleaning and maintenance of laboratory equipment.
Careful preparation and standardisation of solutions.
Performing replicate measurements where appropriate.
Maintaining controlled environmental conditions.
Following documented standard operating procedures (SOPs).
6. Statistical Treatment of Analytical Results
Statistical methods help pharmaceutical analysts interpret experimental data and assess the quality of measurements.
6.1 Mean
The arithmetic mean is the sum of all observations divided by the total number of observations.
x̄ = (x₁ + x₂ + … + xₙ) / n
6.2 Median
The median is the middle value when observations are arranged in ascending or descending order.
Example: 5, 8, 10, 12, 15.
Median = 10.
For an even number of observations, the median is the average of the two middle values.
6.3 Mode
The mode is the value that occurs most frequently in a dataset.
Example: 2, 3, 3, 4, 5.
Mode = 3.
6.4 Standard Deviation
SD is a measure of the dispersion of observations around their mean.
s = √[Σ(xᵢ − x̄)² / (n − 1)]
6.5 Coefficient of Variation
CV (%) = (s / x̄) × 100
It is useful when comparing relative variability between different datasets.
6.6 Confidence Interval
A confidence interval is a range of values calculated using sample data and a specified statistical procedure. It is intended to provide an interval estimate for a population parameter.
For the mean, when the population standard deviation is unknown and the usual assumptions are appropriate:
Confidence Interval = x̄ ± t × (s / √n)
Here:
x̄ = Sample mean.
t = Appropriate critical value from Student’s t-distribution.
s = Sample standard deviation.
n = Sample size.
A 95% confidence interval is commonly used in analytical studies, although the appropriate confidence level depends on the study design and applicable requirements.
6.7 Outliers
An outlier is an observation that differs markedly from the other observations in a dataset.
An unusual result should be investigated to determine whether it is caused by an analytical problem, a recording mistake or genuine sample variability.
Examination point: An outlier must not be automatically deleted merely because it differs from the other results. Any exclusion must be scientifically justified and follow the applicable procedure.
7. Significant Figures
Definition
Significant figures are the meaningful digits in a measured or reported numerical value. They indicate the precision with which a quantity has been expressed.
Significant figures include all certain digits and the final digit, which represents the estimated or uncertain digit in a measurement.
For example:
12.45 contains 4 significant figures.
0.0045 contains 2 significant figures.
25.00 contains 4 significant figures.
Why are significant figures important in pharmacy?
They prevent analytical results from appearing more precise than the measuring instrument or experimental procedure can justify.
7.1 Rules for counting significant figures
Rule 1: All non-zero digits are significant.
Examples:
123 = 3 significant figures.
45.67 = 4 significant figures.
9876 = 4 significant figures.
Rule 2: Zeros between non-zero digits are significant.
1002 = 4 significant figures.
405 = 3 significant figures.
5.006 = 4 significant figures.
7008 = 4 significant figures.
Rule 3: Leading zeros are not significant.
Leading zeros are zeros appearing before the first non-zero digit. They only indicate the position of the decimal point.
0.0045 = 2 significant figures.
0.00078 = 2 significant figures.
0.00306 = 3 significant figures.
0.000506 = 3 significant figures.
Rule 4: Trailing zeros after a decimal point are significant.
2.50 = 3 significant figures.
4.700 = 4 significant figures.
0.2500 = 4 significant figures.
10.00 = 4 significant figures.
Rule 5: Trailing zeros in whole numbers without a decimal point may be ambiguous.
Consider the number 1500. Depending on the intended measurement precision, it may represent 2, 3 or 4 significant figures.
To remove ambiguity, scientific notation should be used:
Scientific notation
Significant figures
1.5 × 10³
2
1.50 × 10³
3
1.500 × 10³
4
Rule 6: Exact numbers have unlimited significant figures for calculation purposes.
Exact numbers are obtained through counting or definitions rather than measurements.
Examples:
12 tablets counted exactly.
60 seconds in one minute by definition.
1000 mg in 1 g by definition.
3 patients counted in a group.
These exact quantities do not limit the significant figures in a calculation.
7.2 Significant figures in scientific notation
Scientific notation expresses a number in the form:
N = a × 10ⁿ
Where 1 ≤ |a| < 10 and n is an integer.
Only the digits in the coefficient are counted as significant figures. The exponent does not affect the number of significant figures.
Examples:
3.45 × 10² = 3 significant figures.
6.200 × 10⁻³ = 4 significant figures.
8.0 × 10⁴ = 2 significant figures.
7.3 Significant figures and decimal places
Significant figures and decimal places are different concepts.
Significant figures: Count all meaningful digits.
Decimal places: Count digits appearing after the decimal point.
Number
Significant figures
Decimal places
12.45
4
2
0.0056
2
4
25.00
4
2
100.5
4
1
0.0400
3
4
8. Rounding-Off Rules
Rounding is the process of reducing the number of digits in a value while retaining an appropriate approximation.
In pharmaceutical calculations, rounding should follow the applicable pharmacopoeial, regulatory or laboratory procedure. The following are common classroom rules.
8.1 Conventional rounding rules
Case 1: If the first digit to be removed is less than 5
Keep the preceding digit unchanged.
4.32 rounded to 2 significant figures = 4.3.
7.241 rounded to 3 significant figures = 7.24.
8.623 rounded to 2 significant figures = 8.6.
Case 2: If the first digit to be removed is greater than 5
Increase the preceding retained digit by 1.
4.38 rounded to 2 significant figures = 4.4.
6.78 rounded to 2 significant figures = 6.8.
9.876 rounded to 3 significant figures = 9.88.
Case 3: If the first digit to be removed is exactly 5
For the common half-up classroom convention, increase the last retained digit by 1.
2.45 rounded to 2 significant figures = 2.5.
7.65 rounded to 2 significant figures = 7.7.
Important: Some scientific and computational systems use round-half-to-even (banker’s rounding) instead. Always follow the specified rounding convention. Do not assume every standard or software package uses the same tie-breaking rule.
8.2 Rounding to a specified number of significant figures
Solved examples
Example 1: Round 456.78 to 3 significant figures.
First three digits = 456. The next digit is 7.
Answer = 457.
Example 2: Round 0.004567 to 3 significant figures.
First three significant digits = 4, 5 and 6. Next digit = 7.
Answer = 0.00457.
Example 3: Round 78.234 to 4 significant figures.
First four significant digits = 7, 8, 2 and 3. Next digit = 4.
Answer = 78.23.
9. Significant Figures in Mathematical Calculations
9.1 Addition and Subtraction
For addition and subtraction, the final answer should generally be rounded to the same number of decimal places as the measurement with the fewest decimal places.
Example 1: Addition
12.11 + 18.0 + 1.013 = 31.123
The least precise decimal position is one decimal place.
Final answer = 31.1.
Example 2: Subtraction
25.67 − 3.2 = 22.47
The least precise value has one decimal place.
Final answer = 22.5.
9.2 Multiplication and Division
For multiplication and division, the final answer should generally contain the same number of significant figures as the quantity with the fewest significant figures.
Example 1: Multiplication
2.5 × 3.42 = 8.55
2.5 has 2 significant figures.
3.42 has 3 significant figures.
Final answer = 8.6.
Example 2: Division
15.0 ÷ 4.0 = 3.75
15.0 has 3 significant figures.
4.0 has 2 significant figures.
Final answer = 3.8.
9.3 Mixed mathematical operations
When a calculation contains several operations, follow the appropriate decimal-place or significant-figure rule for each operation. Avoid rounding intermediate values unnecessarily. Retain guard digits and round the final reported result appropriately.
Example
(12.11 + 18.0) ÷ 2.0
First calculate the sum: 30.11.
For addition, the sum is limited to one decimal place (30.1).
Divide by 2.0 and report to 2 significant figures.
Final result = 15 (2 significant figures).
9.4 Logarithms and Antilogarithms
For logarithmic calculations, the number of digits after the decimal point in a common logarithm (the mantissa) corresponds to the number of significant figures in the original number.
Examples:
log₁₀(2.5) = 0.39794 approximately. Since 2.5 has 2 significant figures, report the logarithm as 0.40.
log₁₀(125) = 2.09691 approximately. Since 125 has 3 significant figures, report the logarithm as 2.097.
For an antilogarithm, the number of significant figures in the result corresponds to the number of decimal places in the logarithm’s mantissa.
Remember: The characteristic of a common logarithm does not count as a significant figure. The mantissa is the decimal part.
9.5 Significant figures in square roots and powers
For a power or root calculation, the precision of the final result depends on the precision of the input value and the mathematical operation.
In standard introductory chemistry exercises, the final result is usually reported with the same number of significant figures as the measured input value, unless a more complete uncertainty analysis is required.
Example:
√2.25 = 1.5
2.25 has 3 significant figures, but the square root is 1.5 when reported to 2 significant figures only if the uncertainty/precision convention supports that result. In a simple significant-figure exercise, the result should be written as 1.50 (3 significant figures).
10. Quick Revision Infographic
Accuracy, Precision and Significant Figures at a Glance
11. Importance in Pharmaceutical Chemistry and Pharmacy
11.1 Drug assay
Accuracy and precision are important when determining the amount of active pharmaceutical ingredient in tablets, capsules, injections and other dosage forms.
11.2 Preparation of standard solutions
Accurate weighing and volume measurement are necessary when preparing standard solutions used in titrations and instrumental analysis.
11.3 Quality control
Pharmaceutical quality-control laboratories evaluate analytical procedures to ensure that their results are suitable for the intended testing purpose.
11.4 Pharmaceutical formulation
Correct measurement of ingredients is essential when preparing dosage forms with the intended composition and concentration.
11.5 Stability studies
Analytical procedures are used to measure drug content and degradation products during stability testing. Suitable accuracy and precision help ensure that changes in results are meaningful.
11.6 Instrumental analysis
Accuracy, precision and appropriate reporting of significant figures are relevant to UV-visible spectrophotometry, HPLC, gas chromatography, titrimetry and other quantitative analytical techniques.
11.7 Pharmaceutical calculations
Significant figures help prevent false precision when calculating concentrations, dilutions, molarity, percentage strength and quantities of pharmaceutical ingredients.
12. Important Facts for HP Pharmacy Examination
Accuracy
Closeness of a measurement to an accepted reference value.
Precision
Closeness of agreement among repeated measurements.
Repeatability
Precision under the same conditions over a short interval.
Intermediate Precision
Within-laboratory variations such as days, analysts and equipment.
Reproducibility
Precision assessed between different laboratories.
RSD
Standard deviation expressed as a percentage of the mean.
Frequently Asked One-Line Facts
Accuracy describes closeness to a reference value.
Precision describes the scatter of repeated measurements.
Accuracy is a qualitative metrological concept.
Standard deviation is commonly used to express precision.
RSD is also called coefficient of variation when expressed as a percentage.
Repeatability is evaluated under repeatability conditions.
Intermediate precision is assessed within the same laboratory.
Reproducibility is assessed between laboratories.
Leading zeros are not significant.
Zeros between non-zero digits are significant.
Trailing zeros after a decimal point are significant.
Exact counted numbers do not limit significant figures.
Addition and subtraction use the decimal-place rule.
Multiplication and division use the significant-figure rule.
Scientific notation removes ambiguity in trailing zeros.
Systematic errors produce bias.
Random errors produce scatter.
Gross errors are major operational or recording mistakes.
Recovery studies are commonly used to assess analytical accuracy.
ICH Q2(R2) is the guideline for validation of analytical procedures.
13. Important Formula Sheet
Parameter
Formula
Mean
x̄ = Σx / n
Range
Highest value − Lowest value
Sample variance
s² = Σ(xᵢ − x̄)² / (n − 1)
Sample standard deviation
s = √[Σ(xᵢ − x̄)² / (n − 1)]
RSD
(SD / Mean) × 100
Coefficient of variation
(SD / Mean) × 100
Percentage recovery
(Amount recovered / Amount added) × 100
Absolute error
Measured value − Reference value
Percentage relative error
[(Measured − Reference) / Reference] × 100
Confidence interval for mean
x̄ ± t(s / √n)
HIMEXAM.COMPHARMACEUTICAL CHEMISTRYTOPIC 2
Section 1: Basic and Conceptual MCQs
Question 1. Accuracy in analytical chemistry is best defined as which of the following?
The closeness of repeated measurements to one another
The number of significant figures present in an analytical result
The closeness of agreement between a measured result and an accepted reference value
The ability of an instrument to produce identical readings under all conditions
Correct Answer: C
Explanation: Accuracy indicates how close a measured result is to the true or accepted reference value. It is an important characteristic of an analytical procedure used for pharmaceutical quality control.
Question 2. Which of the following statistical parameters is most commonly used to express the precision of repeated analytical measurements?
Standard deviation
Percentage recovery
Absolute error
Reference value
Correct Answer: A
Explanation: Standard deviation measures the dispersion of repeated observations around their mean. A smaller standard deviation generally indicates better precision for comparable measurements.
Question 3. An analyst obtains five results of 99.8, 99.9, 100.0, 100.1 and 99.9 mg/L for a homogeneous drug sample. These results primarily demonstrate:
Poor reproducibility
High systematic error
Gross analytical error
Good precision
Correct Answer: D
Explanation: The measurements are very close to one another, indicating low scatter and good precision. Accuracy cannot be conclusively established without comparing their results with an accepted reference value.
Question 4. A pharmaceutical analytical method repeatedly gives results close to 105 mg when the accepted reference value is 100 mg. Which statement best describes this situation?
High accuracy and poor precision
Good precision but poor accuracy
High accuracy and high precision
Neither precision nor systematic bias is present
Correct Answer: B
Explanation: If repeated measurements consistently remain close to 105 mg, the method may have good precision. However, because the results are systematically higher than the accepted value of 100 mg, accuracy is poor.
Question 5. Which of the following is an appropriate method for evaluating the accuracy of an analytical procedure during validation?
Determining only the range of replicate readings
Calculating only the standard deviation
Performing recovery studies using known amounts of analyte
Counting the number of decimal places in the result
Correct Answer: C
Explanation: Recovery studies involve adding known quantities of analyte to a sample matrix and measuring the amount recovered. This helps evaluate the accuracy of the analytical procedure.
Question 6. The closeness of agreement among independent test results obtained under specified conditions is known as:
Precision
Accuracy
Linearity
Specificity
Correct Answer: A
Explanation: Precision describes the closeness of agreement among repeated measurements. It is commonly evaluated using standard deviation, variance and relative standard deviation.
Question 7. Which of the following correctly describes the relationship between accuracy and precision?
Accuracy and precision always increase together
Precision is another name for percentage recovery
A precise method must always be accurate
A method can be precise but inaccurate
Correct Answer: D
Explanation: Precision and accuracy are separate characteristics. A method may produce highly consistent results that are systematically different from the accepted reference value.
Question 8. In pharmaceutical analysis, the percentage recovery of an added analyte is calculated using which expression?
(Standard deviation / Mean) × 100
(Amount recovered / Amount added) × 100
(Measured value − Reference value) / Reference value
(Highest value − Lowest value) / Mean
Correct Answer: B
Explanation: Percentage recovery is calculated by dividing the amount of analyte recovered by the amount added and multiplying by 100. It is commonly used in analytical recovery studies.
Question 9. Which type of analytical error is primarily responsible for a consistent deviation of measured results from the accepted reference value?
Random error
Gross error
Systematic error
Sampling fluctuation only
Correct Answer: C
Explanation: Systematic errors produce a consistent bias or pattern in analytical results. Examples include incorrect calibration, impure reference substances and consistent instrumental errors.
Question 10. Which of the following statements about random errors is correct?
They always shift results in a positive direction
They are always caused by incorrect calibration
They can be completely eliminated by taking one measurement
They produce unpredictable variation among repeated measurements
Correct Answer: D
Explanation: Random errors arise from unpredictable variations in experimental conditions. They produce scatter in analytical results and primarily affect precision.
Section 2: Precision, Errors and Statistical Methods
Question 11. Precision assessed under the same operating conditions over a short period of time is known as:
Repeatability
Reproducibility
Intermediate precision
Accuracy
Correct Answer: A
Explanation: Repeatability is a measure of precision under repeatability conditions, generally involving the same laboratory, method, analyst and equipment over a short interval of time.
Within the same laboratory under changed relevant conditions
Only between different countries
Only between different pharmaceutical manufacturers
Correct Answer: B
Explanation: Intermediate precision evaluates within-laboratory variations such as different analysts, different days and different instruments, where relevant to the analytical procedure.
Question 13. Reproducibility is most appropriately assessed by conducting analytical measurements:
Using only one analyst repeatedly
Using one instrument on the same day
In different laboratories
Using only one standard solution
Correct Answer: C
Explanation: Reproducibility measures precision between laboratories. It is generally evaluated through inter-laboratory studies or collaborative trials.
Question 14. Which of the following formulas is used to calculate the arithmetic mean of a set of experimental observations?
Mean = Highest value − Lowest value
Mean = Standard deviation / Number of observations
Mean = Sum of squared deviations / n
Mean = Sum of observations / Number of observations
Correct Answer: D
Explanation: The arithmetic mean is the total of all observations divided by the number of observations. It is commonly used as a measure of central tendency in analytical chemistry.
Question 15. Which expression represents the sample variance of a set of observations?
Σ(xᵢ − x̄)² / (n − 1)
Σ(xᵢ − x̄) / n
Σxᵢ / (n − 1)
√[Σ(xᵢ − x̄)² / n]
Correct Answer: A
Explanation: Sample variance is calculated by dividing the sum of squared deviations from the sample mean by n − 1. The denominator n − 1 represents the degrees of freedom for this calculation.
Question 16. The coefficient of variation is mathematically equivalent to which of the following when expressed as a percentage?
Absolute error
Relative standard deviation
Percentage recovery
Percentage relative error
Correct Answer: B
Explanation: Coefficient of variation and relative standard deviation are calculated as standard deviation divided by mean and multiplied by 100, in the usual analytical application.
Question 17. Which of the following is the correct formula for calculating the sample standard deviation?
Σx / n
Σ(xᵢ − x̄)² / (n − 1)
√[Σ(xᵢ − x̄)² / (n − 1)]
(Highest value − Lowest value) × 100
Correct Answer: C
Explanation: Sample standard deviation is the square root of sample variance. It expresses dispersion in the same units as the original measurements.
Question 18. A set of analytical results is 12, 14, 16, 18 and 20. What is the arithmetic mean?
Question 22. In a normal distribution, approximately what percentage of observations lie within one standard deviation of the mean?
50%
68%
95%
99.7%
Correct Answer: B
Explanation: According to the empirical rule for a normal distribution, approximately 68.27% of observations lie within one standard deviation, approximately 95.45% within two standard deviations and approximately 99.73% within three standard deviations of the mean.
Question 23. Which statement correctly describes a 95% confidence interval for a population mean, when constructed using an appropriate statistical method?
It means that 95% of individual observations must lie inside the interval
It means that the sample mean is always 95% accurate
It means that 95% of measurements are identical
In repeated sampling, approximately 95% of intervals constructed by the procedure would contain the true population mean
Correct Answer: D
Explanation: A 95% confidence level describes the long-run coverage property of the interval estimation procedure. It does not mean that 95% of individual measurements fall within the interval.
Question 24. Which distribution is commonly used to calculate a confidence interval for a population mean when the population standard deviation is unknown and the assumptions are appropriate?
Student’s t-distribution
Poisson distribution only
Uniform distribution only
Binomial distribution only
Correct Answer: A
Explanation: Student’s t-distribution is commonly used for confidence intervals for a mean when the population standard deviation is unknown. The appropriate degrees of freedom are generally n − 1 for a one-sample interval.
Question 25. Which statement about an outlier in pharmaceutical analytical data is scientifically appropriate?
Every extreme observation must be deleted
An outlier must always be replaced by the mean
An unusual observation should be investigated before any justified exclusion
Outliers have no effect on statistical calculations
Correct Answer: C
Explanation: An unusual observation may result from an analytical error or genuine variability. It should be investigated using an appropriate documented procedure rather than automatically deleted.
Question 26. Which of the following is an example of a gross analytical error?
Small unpredictable temperature fluctuations
Recording 0.25 g instead of the actual measured value of 0.52 g
Minor random variations in instrument response
Normal variation between replicate measurements
Correct Answer: B
Explanation: Recording an incorrect value is a major recording or operational mistake, classified as a gross error or blunder. It can seriously affect the analytical conclusion.
Question 27. Which of the following errors is most likely to arise from the consistent use of an incorrectly calibrated analytical balance?
Random error
Gross error only
Unavoidable sampling variation
Systematic error
Correct Answer: D
Explanation: An incorrectly calibrated balance can introduce a consistent bias into mass measurements. This is an example of instrumental systematic error.
Question 28. A laboratory performs six replicate determinations at 100% of the test concentration to evaluate repeatability. This approach is consistent with which guideline?
ICH Q2(R2)
ICH Q1A(R2) only
ICH Q3D only
ICH Q8 only
Correct Answer: A
Explanation: ICH Q2(R2), Validation of Analytical Procedures, describes approaches to assessing repeatability, including at least six determinations at 100% of the test concentration or at least nine determinations across the reportable range.
Question 29. Which of the following statements about sample standard deviation and population standard deviation is correct?
Both always use n − 1 in the denominator
Both always use n in the denominator
Sample SD uses n − 1, whereas population SD uses N
Population SD is always greater than sample SD
Correct Answer: C
Explanation: Sample standard deviation uses n − 1 in the denominator for the usual unbiased sample variance estimate. Population standard deviation uses N because it describes the complete population.
Question 30. Which measure of central tendency represents the middle observation after arranging the data in ascending or descending order?
Mean
Median
Mode
Variance
Correct Answer: B
Explanation: The median is the middle observation in an ordered dataset. For an even number of observations, it is the arithmetic mean of the two middle values.
Section 4: Significant Figures and Numerical Rules
Question 31. How many significant figures are present in the number 0.004050?
2
3
5
4
Correct Answer: D
Explanation: The leading zeros are not significant. The significant digits are 4, 0, 5 and the final zero after the decimal portion. Therefore, there are four significant figures.
Question 32. Which of the following numbers contains exactly three significant figures?
0.0050
2.500
0.0405
100.00
Correct Answer: C
Explanation: In 0.0405, the leading zeros are insignificant, while 4, the zero between 4 and 5, and 5 are significant. Hence, it has three significant figures.
Question 33. Which statement about leading zeros in a decimal number is correct?
They are not significant because they only indicate the position of the decimal point
They are always significant
They are significant only in pharmaceutical calculations
They increase the precision of a measurement
Correct Answer: A
Explanation: Leading zeros appear before the first non-zero digit and are not counted as significant figures. For example, 0.0045 contains two significant figures.
Question 34. How many significant figures are present in 2.500?
2
4
3
5
Correct Answer: B
Explanation: All non-zero digits and trailing zeros after a decimal point are significant. Therefore, 2.500 contains four significant figures.
Question 35. The number 1.500 × 10³ contains how many significant figures?
2
3
5
4
Correct Answer: D
Explanation: Only the coefficient is considered when counting significant figures in scientific notation. The coefficient 1.500 contains four significant figures. The exponent does not affect the count.
Question 36. Which of the following whole numbers is ambiguous regarding its number of significant figures when written without a decimal point or additional notation?
1500
1234
5678
9876
Correct Answer: A
Explanation: In 1500, the trailing zeros may or may not be significant depending on the measurement precision. Scientific notation, such as 1.5 × 10³ or 1.500 × 10³, removes this ambiguity.
Question 37. Which of the following quantities is an exact number and therefore does not limit significant figures in a calculation?
Mass measured using a balance
Temperature measured using a thermometer
12 tablets counted exactly
Volume measured using a burette
Correct Answer: C
Explanation: A counted quantity is exact when the counting is unambiguous. Exact numbers have no measurement uncertainty and do not limit significant figures in calculations.
Question 38. How many significant figures are present in 100.50?
3
4
6
5
Correct Answer: D
Explanation: The zero between non-zero digits is significant, and trailing zeros after the decimal point are also significant. Therefore, 100.50 contains five significant figures.
Question 39. Which of the following statements correctly distinguishes significant figures from decimal places?
Both terms always represent the same quantity
Significant figures count meaningful digits, whereas decimal places count digits after the decimal point
Decimal places are counted from the first non-zero digit
Significant figures are counted only after the decimal point
Correct Answer: B
Explanation: Significant figures include all meaningful digits in a value, whereas decimal places refer only to the number of digits appearing after the decimal point. For example, 0.0056 has two significant figures and four decimal places.
Question 40. Which of the following is the correct scientific notation for 0.000456?
4.56 × 10⁻⁴
45.6 × 10⁻⁵
0.456 × 10⁻³
4.56 × 10⁴
Correct Answer: A
Explanation: The decimal point is moved four places to the right to obtain 4.56. Therefore, the exponent is −4, giving 4.56 × 10⁻⁴.
Section 5: Rounding and Mathematical Calculations
Question 41. Round 456.78 to three significant figures using conventional half-up rounding.
456
456.8
457
460.0
Correct Answer: C
Explanation: The first three significant digits are 4, 5 and 6. The next digit is 7, so the third digit is increased by one. The result is 457.
Question 42. What is the correct result of 12.11 + 18.0 + 1.013 when reported according to the addition and subtraction significant-figure rule?
31.123
31.1
31.12
31
Correct Answer: B
Explanation: The unrounded sum is 31.123. The least precise measurement has one decimal place, so the final answer is 31.1.
Question 43. Calculate 2.5 × 3.42 and report the answer using the multiplication significant-figure rule.
8.55
8.50
8.555
8.6
Correct Answer: D
Explanation: The product is 8.55. The factor 2.5 has two significant figures, while 3.42 has three. The final answer is therefore 8.6, containing two significant figures.
Question 44. Calculate 25.67 − 3.2 using the correct decimal-place rule.
22.5
22.47
22.470
22
Correct Answer: A
Explanation: The unrounded result is 22.47. Since 3.2 has only one decimal place, the answer must be rounded to one decimal place: 22.5.
Question 45. Calculate 15.0 ÷ 4.0 and report the result according to significant-figure rules.
3.75
3.750
3.8
4.0
Correct Answer: C
Explanation: The unrounded result is 3.75. The divisor 4.0 has two significant figures, which is the limiting quantity. Therefore, the answer is 3.8.
Question 46. What is the correctly rounded value of 0.004567 to three significant figures?
0.00456
0.00457
0.0046
0.00500
Correct Answer: B
Explanation: The first three significant digits are 4, 5 and 6. The next digit is 7, so 6 is increased to 7. The answer is 0.00457.
Question 47. The common logarithm of 2.50 is approximately 0.39794. How should it be reported according to the significant-figure convention for logarithms?
0.39794
0.398
0.40
0.4
Correct Answer: C
Explanation: The number 2.50 contains three significant figures. Therefore, its common logarithm should be reported with three decimal places in the mantissa: 0.398 would be appropriate if rounded conventionally. However, the exact rounding of 0.39794 to three decimal places is 0.398. The correct answer is therefore B.
Question 48. Which of the following results is correctly expressed to two significant figures?
7.86 rounded to 7.9
7.86 rounded to 7.86
7.86 rounded to 7.80
7.86 rounded to 8.00
Correct Answer: A
Explanation: The first two significant digits are 7 and 8. The next digit is 6, so the 8 is rounded upward. The correct result is 7.9.
Question 49. A pharmaceutical solution has a measured concentration of 98 mg/L, whereas its accepted reference concentration is 100 mg/L. What is the percentage relative error?
+2%
−2%
−98%
+98%
Correct Answer: B
Explanation: Percentage relative error = [(98 − 100) / 100] × 100 = −2%. The negative sign indicates that the measured result is lower than the reference value.
Question 50. An analyst adds 40 mg of a standard drug substance to a sample matrix and recovers 38 mg. Calculate the percentage recovery of the added amount.
90%
92%
96%
95%
Correct Answer: D
Explanation: Percentage recovery = (38 / 40) × 100 = 95%. This represents recovery of the added analyte under the conditions of the study.
Section 6: Statement-Based and Advanced Examination MCQs
Question 51. Consider the following statements regarding accuracy and precision:
Statement I: Accuracy describes the closeness of a measured result to an accepted reference value.
Statement II: Precision describes the closeness of agreement among repeated measurements.
Statement III: A method showing good precision must always demonstrate good accuracy.
Which of the following is correct?
Statements I and III only are correct
Statements II and III only are correct
Statements I and II only are correct
All three statements are correct
Correct Answer: C
Explanation: Statements I and II are correct definitions. Statement III is incorrect because a method can give highly consistent but systematically biased results, demonstrating precision without accuracy.
Question 52. Consider the following statements about the types of precision:
1. Repeatability is generally evaluated under the same operating conditions over a short interval.
2. Intermediate precision involves variations within the same laboratory.
3. Reproducibility is generally evaluated between different laboratories.
4. Repeatability and reproducibility are exactly the same validation characteristic.
Select the correct combination.
1, 2 and 3 only
1 and 4 only
2 and 4 only
1, 2, 3 and 4
Correct Answer: A
Explanation: Statements 1, 2 and 3 correctly describe the three levels of precision. Statement 4 is incorrect because repeatability concerns same-condition measurements, whereas reproducibility concerns inter-laboratory precision.
Question 53. Examine the following statements concerning analytical errors:
Statement I: Systematic errors can introduce a consistent bias into analytical measurements.
Statement II: Random errors produce unpredictable variation in results.
Statement III: Gross errors may arise from incorrect recording or handling of a sample.
Statement IV: Random errors always produce the same numerical deviation in every measurement.
Which statements are correct?
Statements I and IV only
Statements II and IV only
Statements I, II and IV only
Statements I, II and III only
Correct Answer: D
Explanation: Systematic errors can cause consistent bias, random errors produce unpredictable variation and gross errors include major mistakes in handling or recording. Statement IV is false because random errors do not produce an identical deviation in every measurement.
Question 54. Consider the following statements about significant figures:
1. All non-zero digits are significant.
2. Zeros between non-zero digits are significant.
3. Leading zeros are significant.
4. Trailing zeros after a decimal point are significant.
Which combination is correct?
1 and 3 only
1, 2 and 4 only
2, 3 and 4 only
All four statements
Correct Answer: B
Explanation: Non-zero digits, captive zeros and trailing zeros after a decimal point are significant. Leading zeros are not significant because they only indicate decimal placement.
Question 55. Consider the following statements regarding significant figures in mathematical calculations:
Statement I: Addition and subtraction generally follow the decimal-place rule.
Statement II: Multiplication and division generally follow the significant-figure rule.
Statement III: Intermediate calculations should be rounded immediately after every operation.
Choose the correct answer.
Statement I only
Statements II and III only
Statements I and II only
All three statements
Correct Answer: C
Explanation: Statements I and II are correct. Statement III is incorrect because premature rounding can introduce cumulative rounding errors. Guard digits should generally be retained until the final result is reported.
Question 56. Consider the following statements about ICH Q2(R2):
1. It provides guidance for validation of analytical procedures.
2. Accuracy and precision are among the performance characteristics considered in analytical procedure validation.
3. Repeatability may be assessed using at least six determinations at 100% test concentration.
4. Reproducibility is the same as repeatability.
Which statements are correct?
1, 2 and 3 only
1 and 4 only
2 and 4 only
All four statements
Correct Answer: A
Explanation: ICH Q2(R2) provides guidance on analytical procedure validation. It covers accuracy and precision and includes the six determinations at 100% concentration approach for repeatability. Reproducibility is not the same as repeatability.
Question 57. A pharmaceutical analyst obtains the following results for a homogeneous sample: 98.1, 98.2, 98.1, 98.2 and 98.1 mg. The accepted reference value is 100 mg. Which interpretation is most appropriate?
Poor precision and high accuracy
Good precision but evidence of negative bias and reduced accuracy
High accuracy and high precision
Random errors are completely absent
Correct Answer: B
Explanation: The results are closely grouped, showing good precision. However, their values are consistently below the accepted reference value, indicating negative bias and a lack of accuracy relative to that reference.
Question 58. Consider the following statements about pharmaceutical applications of accuracy and precision:
1. Accuracy is important in determining the actual content of an active pharmaceutical ingredient.
2. Precision is important when evaluating the consistency of replicate assay results.
3. Significant figures help avoid reporting unsupported numerical precision.
4. Precision alone establishes that an analytical method is suitable for every intended purpose.
Which of the following is correct?
1 and 4 only
2 and 4 only
1, 2 and 4 only
1, 2 and 3 only
Correct Answer: D
Explanation: Statements 1, 2 and 3 are correct. Precision alone cannot establish that an analytical method is suitable for its intended purpose. Other validation characteristics, such as accuracy, specificity, range and linearity where applicable, must also be considered.
Question 59. An analytical procedure produces the following results: 10.0, 10.1, 9.9, 10.0 and 10.0. The accepted reference value is 10.0. Which conclusion is most reasonable?
The results demonstrate both good precision and good agreement with the reference value
The results demonstrate poor precision and poor accuracy
The results demonstrate high systematic bias
The results prove that the analytical procedure has zero measurement uncertainty
Correct Answer: A
Explanation: The measurements show very little scatter and are centred around the accepted reference value. They therefore demonstrate good precision and good agreement with the reference value. They do not prove that measurement uncertainty is zero.
Question 60. A pharmaceutical laboratory is validating an analytical method for determining the concentration of an active pharmaceutical ingredient in tablets. Which combination of approaches would provide the most appropriate overall evaluation of accuracy and precision?
Counting decimal places and measuring only one sample
Determining the highest result and ignoring all other observations
Using suitable recovery or reference material studies for accuracy and replicate measurements with statistical evaluation for precision
Using only the calibration range of the instrument without examining analytical results
Correct Answer: C
Explanation: Accuracy should be evaluated through appropriate reference material comparison, recovery studies or another suitable procedure. Precision should be evaluated using replicate measurements and appropriate statistical parameters such as standard deviation and relative standard deviation. Both characteristics are necessary for a sound analytical procedure evaluation.
हमारे बारे में – Himexam.com
Himexam.com हिमाचल प्रदेश व अखिल भारतीय प्रतियोगी परीक्षाओं के लिए एक विश्वसनीय पोर्टल है।
यहाँ आपको नवीनतम HP Govt Jobs, All India Jobs,
HP GK, करेंट अफेयर्स, वन लाइनर प्रश्न,
जिलेवार GK और पिछले वर्षों के प्रश्न पत्र की जानकारी एक ही जगह मिलती है।
हमारी कोशिश है कि हर अभ्यर्थी को सही और समय पर अध्ययन सामग्री मिले।
Hello everyone! My name is Gaurav, My aim is to provide quality educational content, free study materials, and exam preparation resources to help students and job aspirants achieve their goals. I believe quality education should be accessible to everyone.
Hello everyone! My name is Gaurav, My aim is to provide quality educational content, free study materials, and exam preparation resources to help students and job aspirants achieve their goals. I believe quality education should be accessible to everyone.






 WhatsApp
 Facebook
 Telegram
 Instagram